Research
My research interests lie in cosmology and extragalactic science probed with large-scale structure tracers. My work spans several areas within these themes, including:
- developing analysis algorithms to extract information from cosmological surveys,
- constructing data-informed models to improve cosmological analyses,
- designing strategies to mitigate systematic effects in cosmological surveys, and
- analyzing existing datasets to derive constraints on cosmological and astrophysical information.
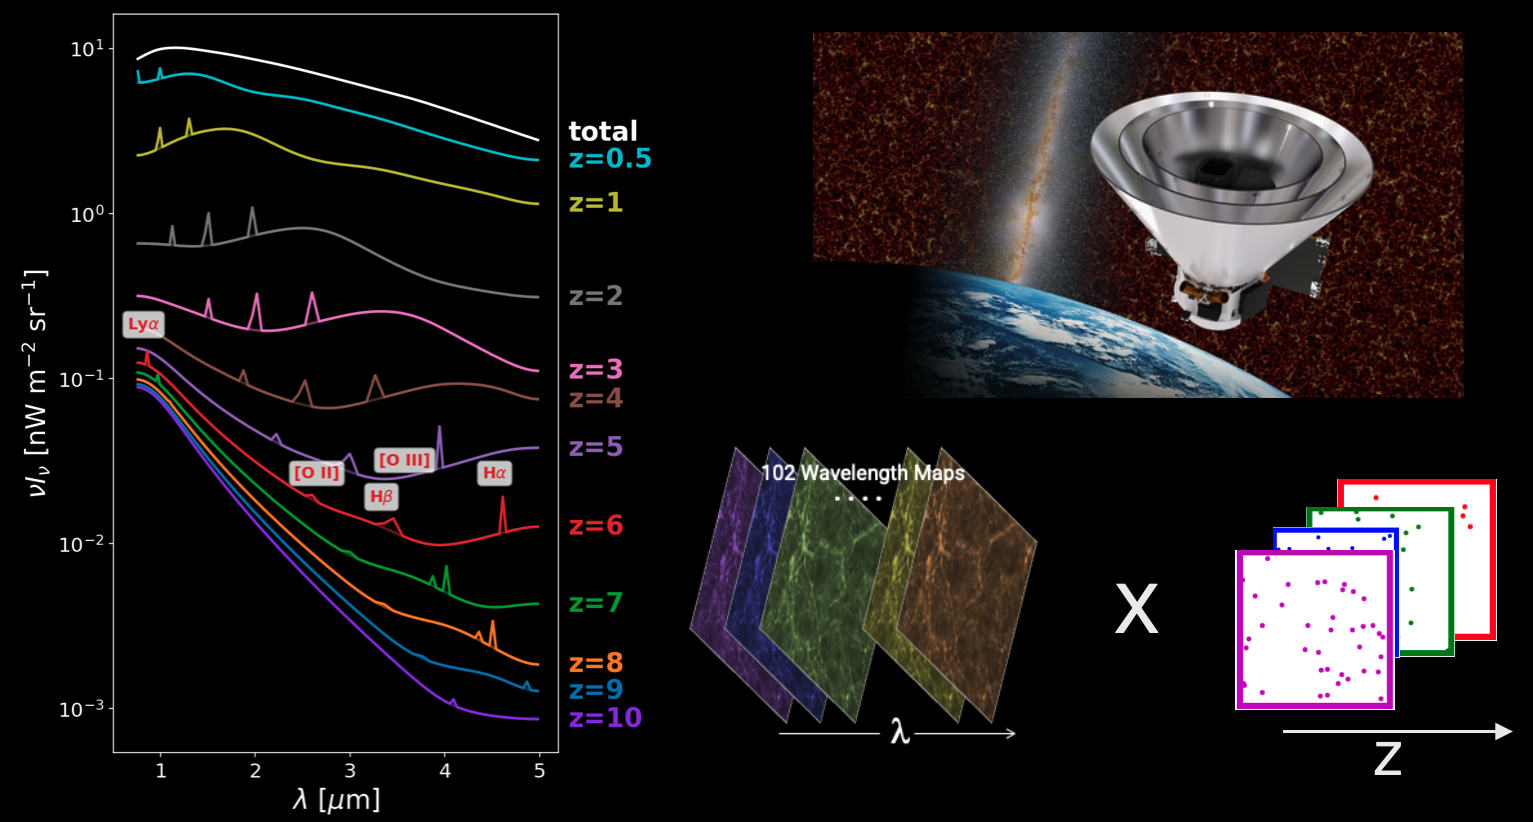
My current work on SPHEREx focuses on optimizing the multi-tracer analysis strategy, as well as the measurement and validation of galaxy redshifts, for its main cosmological objective: constraining the primordial non-Gaussianity signal from large-scale galaxy clustering. I also work on modeling the extragalactic background signal, which SPHEREx will probe with unprecedented high sensitivity and spectral resolution in the near-infrared.
Beyond SPHEREx, I am also actively involved in photometric redshifts, line intensity mapping, the extragalactic background light, and related topics, where my work focuses on developing analysis algorithms and engaging in data analysis.
Bayesian Inference on 3D Light Cones
To fully exploit the rich datasets from modern cosmological surveys, we have developed a novel, data-driven framework for analyzing the 3D light cone observed in multi-band imaging. Unlike traditional galaxy surveys that detect only bright sources, or line intensity mapping which probes emissions from specific spectral lines, our approach uses information from "all photons." Our method simultaneously models the spectral and spatial distribution of all emitting sources while also constraining the underlying large-scale structure they trace. The framework is applicable to both photometric and spectroscopic imaging data, and offers complementary information to upcoming surveys like SPHEREx, Roman, and Euclid. In a series of papers, we have demonstrated its power by applying it to broad-band photometric maps, performing multi-line intensity mapping (LIM), and introducing an extension of LIM called "feature intensity mapping," which maps the 3D emission field from broad spectral features.

Feature Intensity Mapping
Line intensity mapping (LIM) probes the aggregate emission of a spectral line from all sources, without requiring individual detections. Through the wavelength-redshift relation, one can map the line-of-sight evolution of the line emission that traces the underlying large-scale structure in a spectral-imaging survey. In Cheng et al. (2025), we extend our Bayesian Multi-line Intensity Mapping framework developed in Cheng et al. (2024) to map the 3D emission field of broad spectral features, rather than the narrow emission lines typically targeted by LIM, a method we have termed 'feature intensity mapping'. This approach enables 3D intensity mapping with some of the brightest features in galaxies' infrared spectra: the polycyclic aromatic hydrocarbon (PAH) emission bands. We forecast the detectability of PAH signals using this technique with the ongoing SPHEREx mission and the proposed PRIMA mission, finding high prospects for detecting the PAH intensity mapping signal from both surveys.
Relevant Publication:
-
Feature Intensity Mapping: Polycyclic Aromatic Hydrocarbon Emission from All Galaxies Across Cosmic Time
Y.-T. Cheng, B. S. Hensley, T. S.-Y. Lai, 2025, ApJ, 993, 30, ADS, [arXiv:2506.13863]
Bayesian Multi-line Intensity Mapping
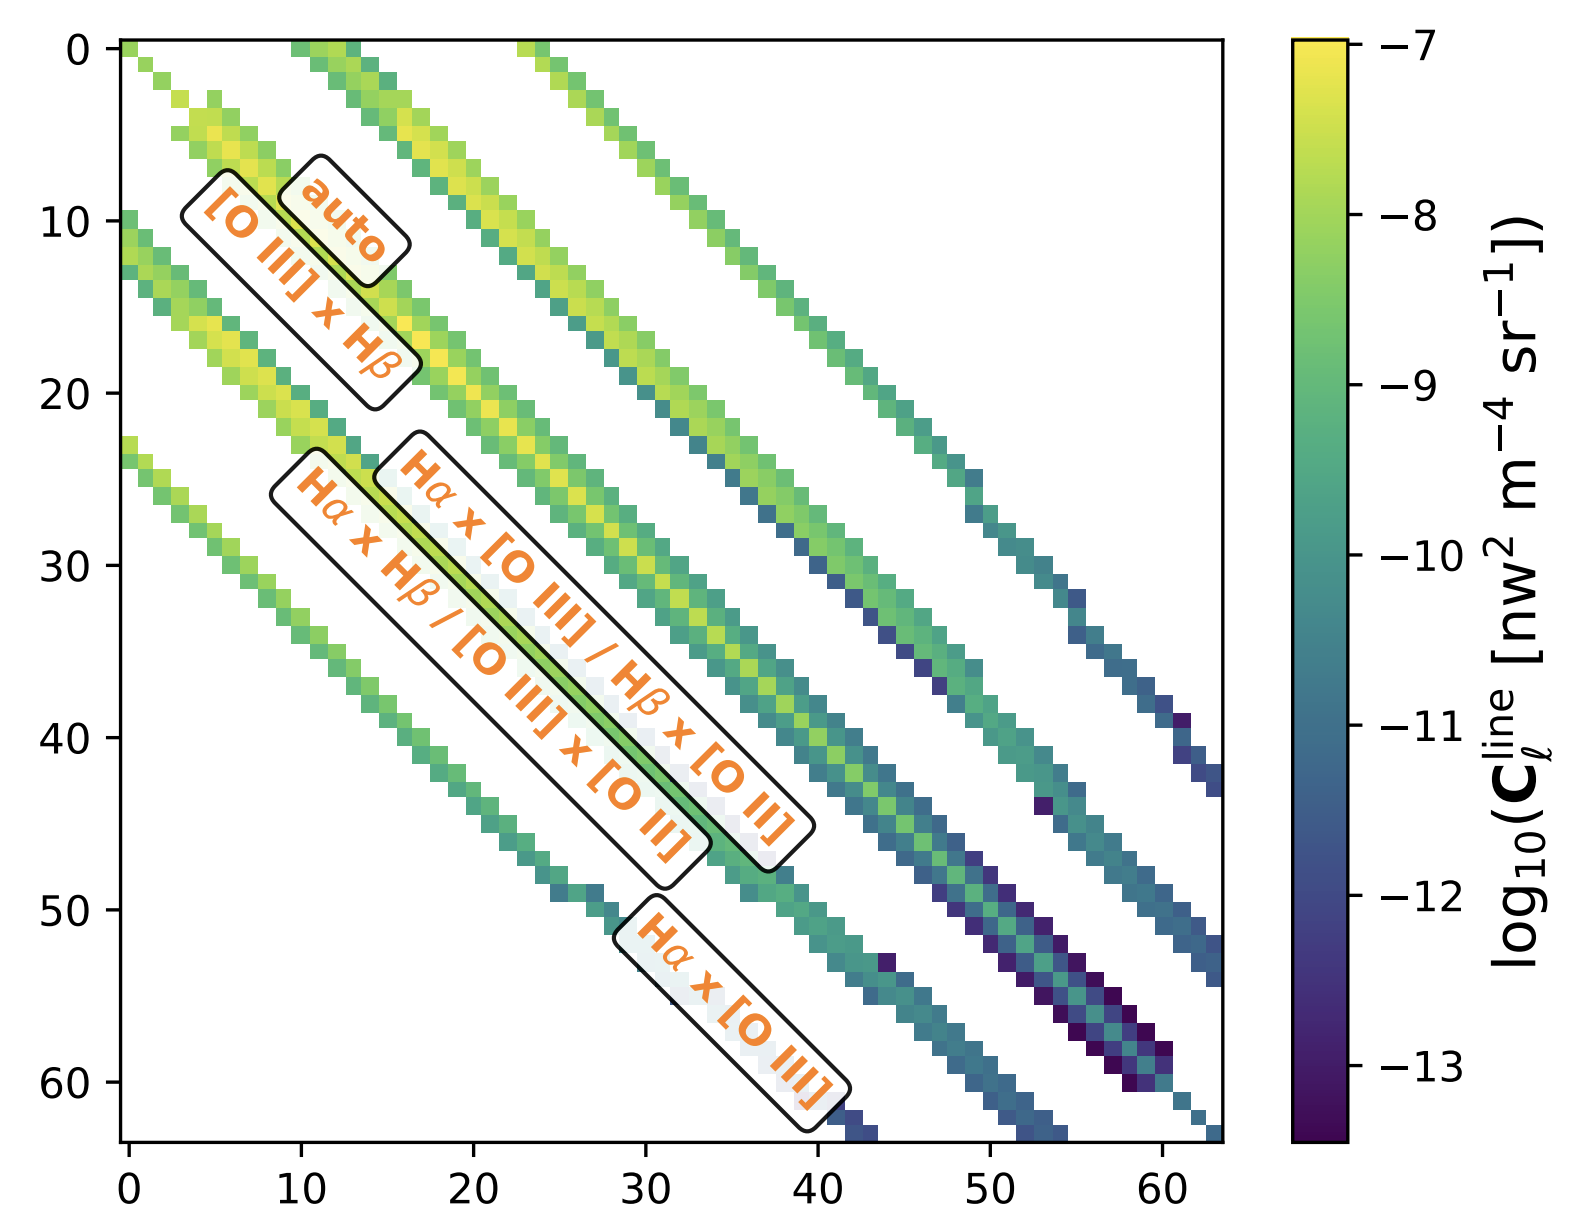
A key challenge in line intensity mapping (LIM) is separating the target signal from contaminating "interloper" lines that fall at the same observed frequency but originate from different redshifts. In Cheng et al. (2024), we apply our 3D light cone analysis framework to develop a novel method to tackle the interloper challenge. Instead of treating interlopers as contaminants, our Bayesian approach leverages the correlated information between all emission lines present in the data, and performs a joint inference that simultaneously extracts the signals from all lines.
A talk recording on this project can be found here.
Relevant Publication:
-
Bayesian Multi-line Intensity Mapping
Y.-T. Cheng, K. Wang, B. D. Wandelt, T.-C. Chang, & O. Doré, 2024, ApJ, 971, 159, ADS, [arXiv:2403.19740]
Data-driven Cosmology from 3D Light Cones
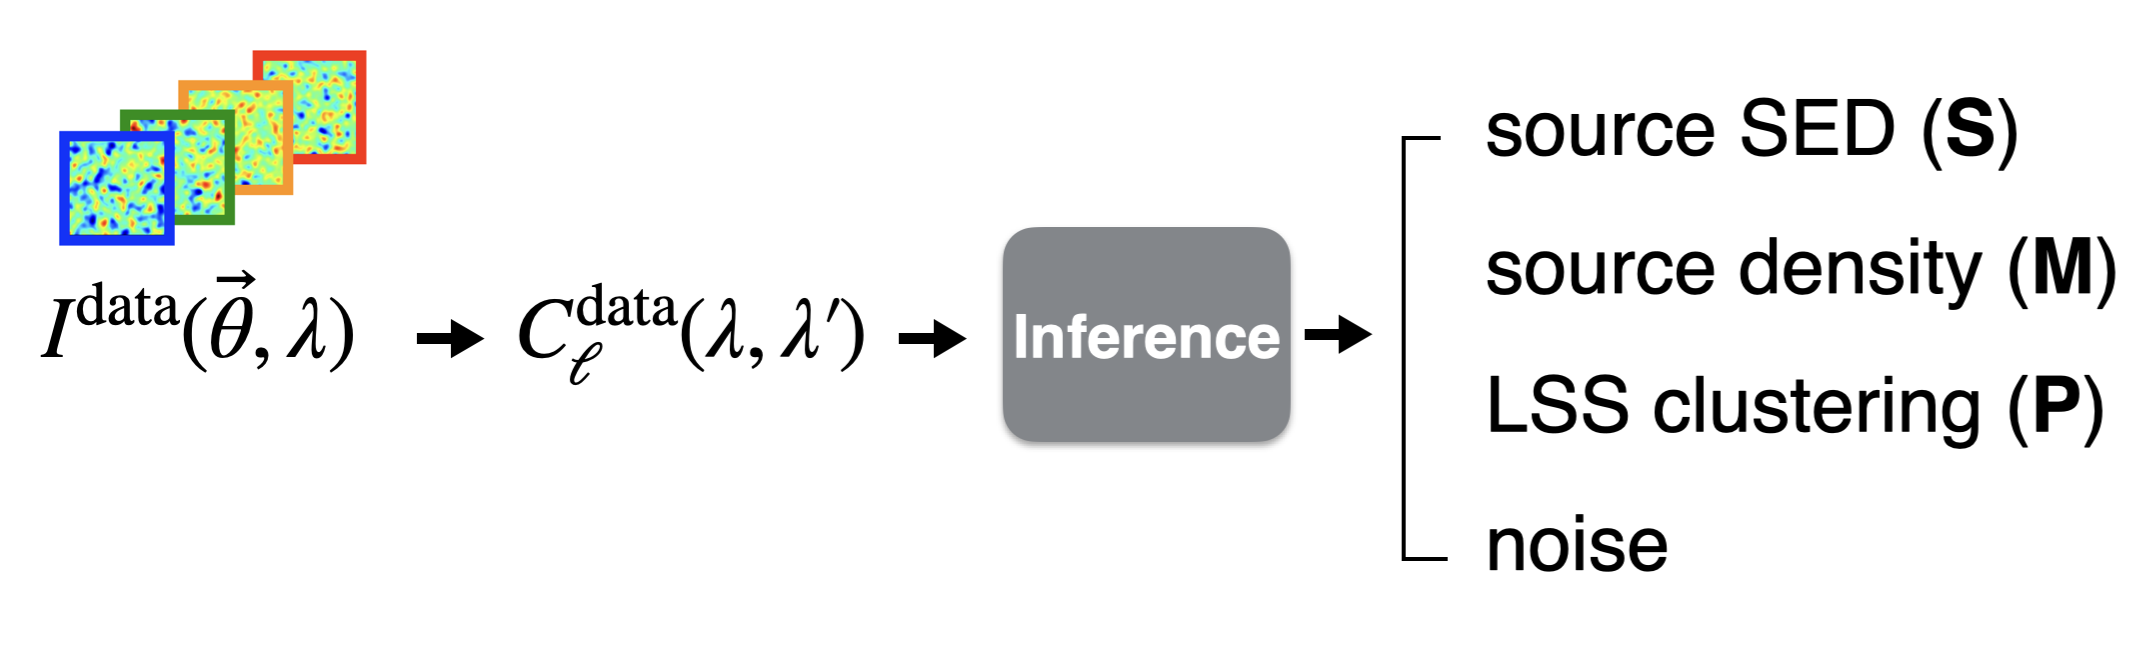
In Cheng et al. (2023), we present the formalism of the 3D light cone analysis framework. This is a data-driven technique to analyze multifrequency images from upcoming cosmological surveys mapping large sky area. Using full information from the data at the two-point level, our method can simultaneously constrain the large-scale structure (LSS), the spectra and redshift distribution of emitting sources, and the noise in the observed data without any prior assumptions beyond the homogeneity and isotropy of cosmological perturbations. In particular, the method does not rely on source detection or photometric or spectroscopic redshift estimates. We demonstrate our technique with a mock observation from nine optical and near-infrared photometric bands. Our method can recover the input signal and noise without bias, and quantify the uncertainty on the constraints.
A talk recording on this project can be found here.
Relevant Publication:
-
Data-driven Cosmology from Three-dimensional Light Cones
Y.-T. Cheng, B. D. Wandelt, T.-C. Chang, & O. Doré, 2023, ApJ, 944, 151, ADS, [arXiv:2210.10052]
Photometric Redshifts
Photometric redshift (photo-z) is a crucial technique in cosmological analysis used to infer the line-of-sight distance of galaxies from their photometry to map the three-dimensional structure of the universe. Photo-z estimation is typically performed with template fitting or machine learning methods, and different approaches are suitable for different types of datasets and scientific goals. It is essential to validate the photo-z results to ensure that potential biases and uncertainties are fully characterized to a level that will not bias the downstream cosmological inference. This validation is typically done by comparing the photo-z estimates for a small subset of galaxies to their precisely measured spectroscopic redshifts. The overall redshift distribution for the entire galaxy sample can also be verified using the clustering redshift method, which involves cross-correlating the photometric sample with thin "slices" of galaxies that have known spectroscopic redshifts.
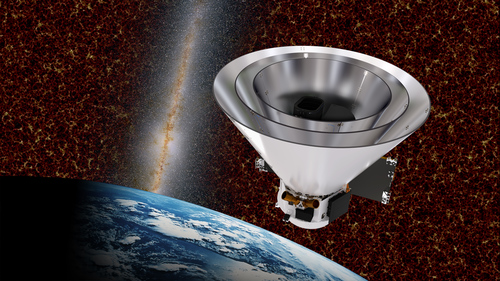
Photo-z Calibration and Validation for SPHEREx
SPHEREx will map the entire sky in 102 near-infrared spectral channels (from 0.75 to 5.0 μm), measuring spectra for hundreds of millions of galaxies. This rich spectral information will enable significantly better photo-z constraints than those from typical broad-band surveys, which are essential for SPHEREx's primary cosmological goal of constraining primordial non-Gaussianity using three-dimensional large-scale galaxy clustering. We focus on developing the end-to-end photo-z measurement and validation pipeline. This involves estimating photo-z's using the baseline template fitting pipeline and validating them against both spectroscopic galaxy samples and the clustering redshift method. Ultimately, we aim to quantify SPHEREx's redshift performance, use this information to optimize the multi-tracer sample selection strategy, and characterize how photo-z uncertainties propagate into the final SPHEREx cosmological analyses.
Relevant Publication:
- Y.-T. Cheng, et al., in preparation
Line Intensity Mapping
Line intensity mapping (LIM) is a technique that traces the 3D large-scale structure of the universe by measuring the cumulative emission of a specific spectral line from all sources within a large volume. Unlike traditional galaxy surveys that only detect bright objects, LIM captures the total, diffuse emission from every source, including those too faint to be seen directly. This makes it an especially powerful probe of the high-redshift universe where individual detections are difficult. By targeting various spectral lines, such as HI 21 cm, CO rotational lines, [C II], Hα, or Lyα, LIM provides unique insights into the physics and evolution of the interstellar medium across cosmic time. Despite its great promise, the primary challenge for LIM is overcoming bright foreground contamination from our galaxy and other sources. These foregrounds must be properly modeled and removed to access the cosmological information from LIM.
Intensity Mapping or Galaxy Detection?
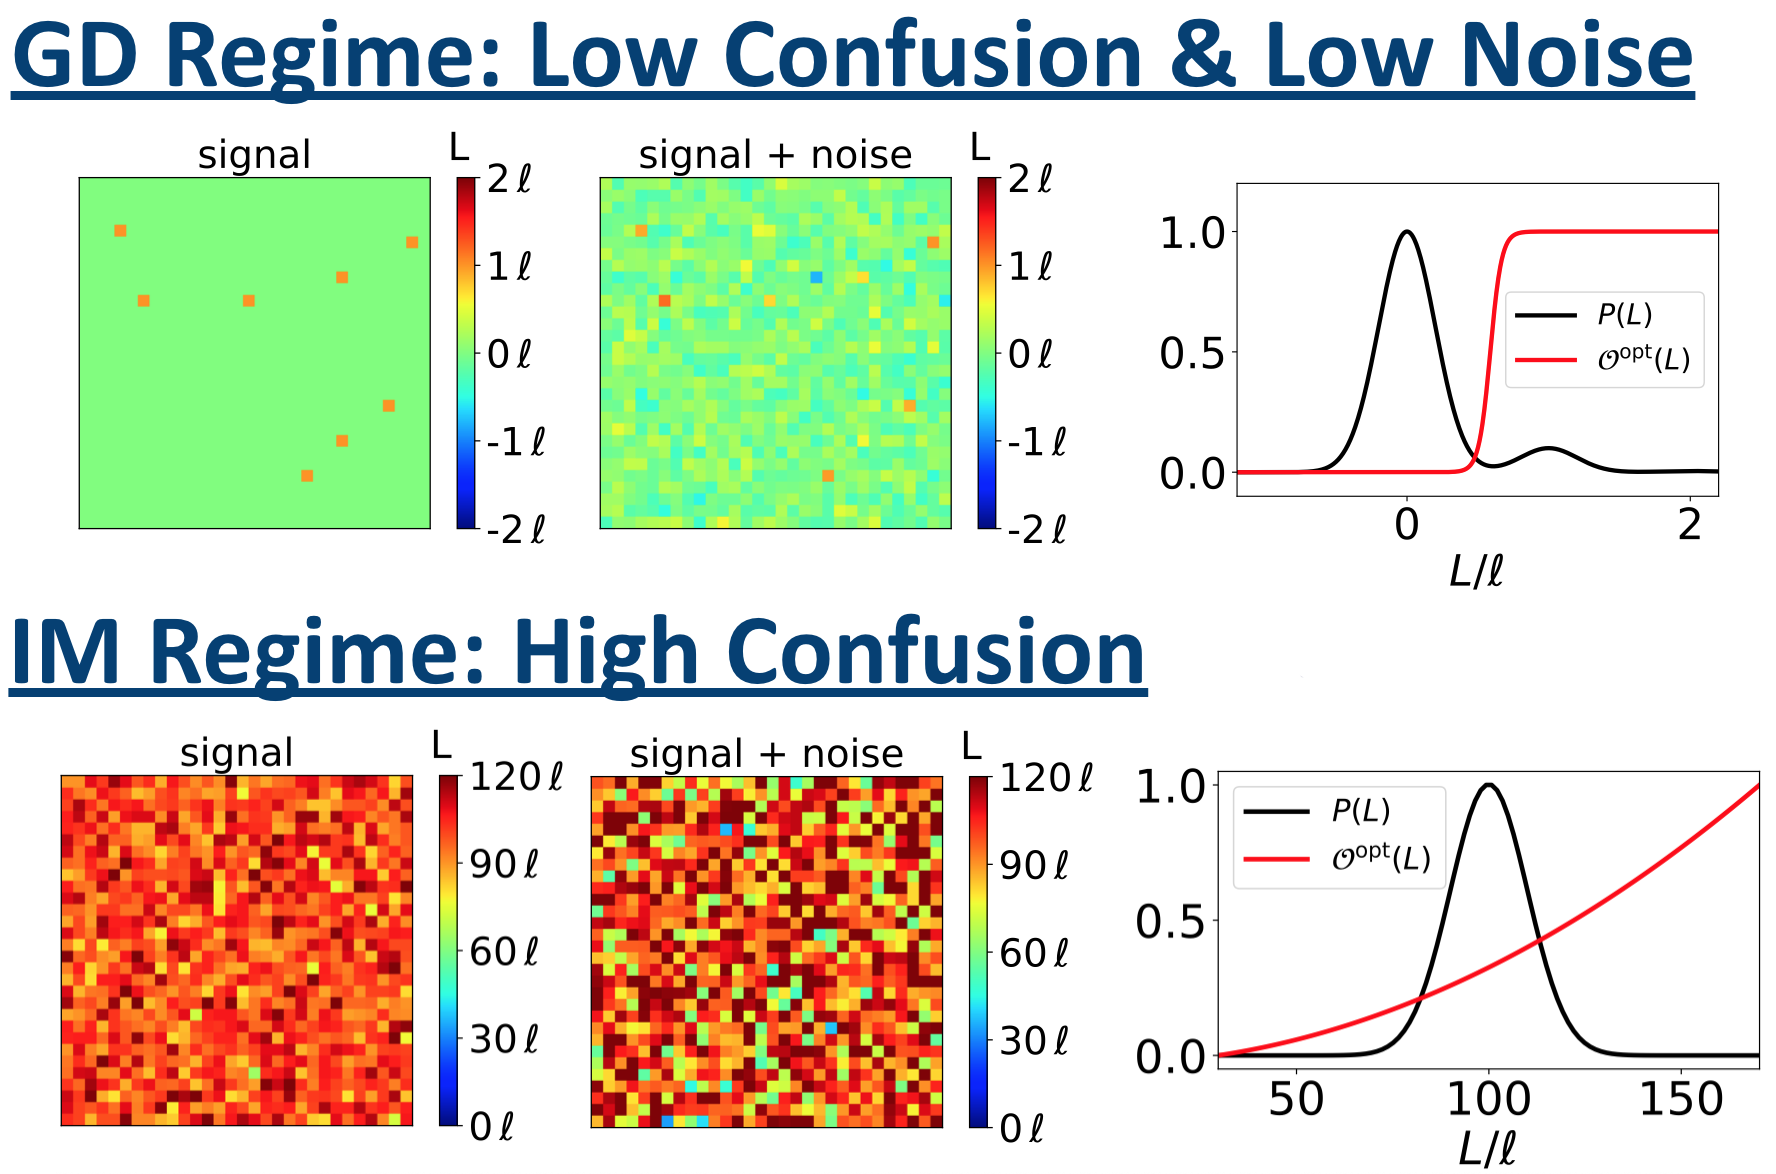
Conventional large-scale structure surveys rely on galaxy detection (GD) methods, while intensity mapping (IM) employs the integrated intensity to trace the underlying density field. In Cheng et al. (2019), we developed a unified framework to describe the information content in both IM and GD using Fisher formalism. This approach enables us to show that depending on the level of source confusion and instrument noise, GD, IM, or a hybrid approach may be optimal. In addition, this framework can serve as an effective tool for optimizing survey design and mapping strategies for upcoming large-scale structure surveys.
Relevant Publication:
-
Optimally Mapping Large-Scale Structures with Luminous Sources
Y.-T. Cheng, R. de Putter, T.-C. Chang, & O. Doré, 2019, ApJ, 877, 86, ADS, [arXiv:1809.06384]
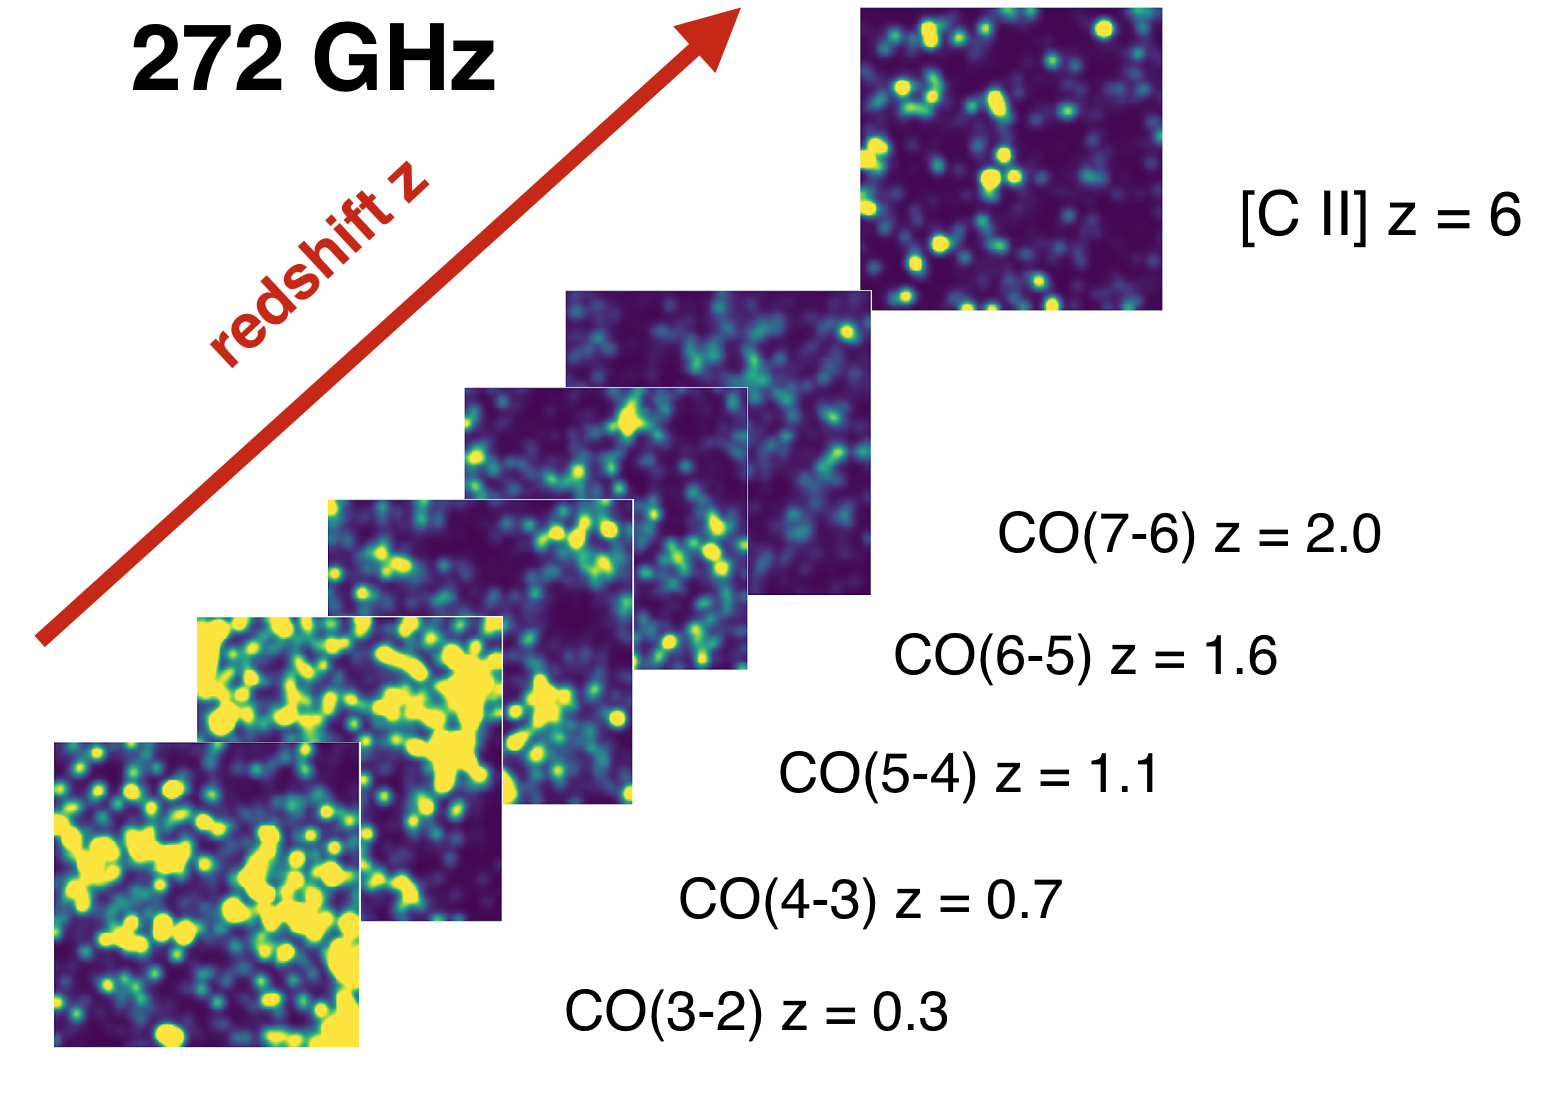
Interloper Line De-confusion
Interloper line foregrounds are a critical challenge in line intensity mapping (LIM). These are spectral lines from sources at different redshifts that overlap at the same observed frequency. For example, a [C II] intensity map targeting the Epoch of Reionization (EoR) can be contaminated by several low-redshift CO rotational transition lines. While traditional methods like masking and cross-correlation can separate these signals, they often depend on high-quality external datasets, such as deep galaxy catalogs. We have developed novel techniques for line de-blending that do not require external data, offering innovative solutions to the interloper challenge.
In LIM, the two-dimensional power spectrum of interloper lines exhibits a unique anisotropic shape. In Cheng et al. (2016), we introduced a technique that exploits this anisotropy to differentiate between the large-scale fluctuations from various lines. Using simulated data, we successfully applied this method to simultaneously extract emissions from both the target [C II] line during the EoR and the contaminating interloper lines.
In Cheng et al. (2020), we presented a map-space approach to line de-blending that reconstructs the three-dimensional spatial distribution of all line-emitting sources. This technique utilizes the fact that sources at different redshifts create distinct, identifiable patterns in the observed spectrum. By modeling these patterns and fitting them with templates using a sparse approximation algorithm, we achieved successful de-confusion of lines in both the TIME-like and SPHEREx-like survey setups.
In Cheng et al. (2024), we introduced a technique, multi-line intensity mapping, that leverages correlated information from different lines to perform a joint inference on multiple line signals simultaneously within a Bayesian framework, and therefore resolving the interloper issue. We demonstrated this technique with a mock survey resembling the SPHEREx deep field, considering four near-infrared spectral lines: Hα, [O III], Hβ, and [O II]. Our results show that the method can extract the power spectrum of all four lines at a significance of ≥ 10σ at z<2. For the brightest line, Hα, this 10σ sensitivity can be achieved out to z ∼ 3.
Relevant Publication:
-
Bayesian Multi-line Intensity Mapping
Y.-T. Cheng, K. Wang, B. D. Wandelt, T.-C. Chang, & O. Doré, 2024, ApJ, 971, 159, ADS, [arXiv:2403.19740] -
Phase-Space Spectral Line De-confusion in Intensity Mapping
Y.-T. Cheng, T.-C. Chang, & J. J. Bock, 2020, ApJ, 901, 142, ADS, [arXiv:2005.05341] -
Spectral Line De-Confusion in an Intensity Mapping Survey
Y.-T. Cheng, T.-C. Chang, J. J. Bock, C. M. Bradford, & A. R. Cooray, 2016, ApJ, 832, 165, ADS, [arXiv:1604.07833]
PAH Intensity Mapping
In Cheng et al. (2025), we present a new technique, feature intensity mapping, as an extension of the LIM formalism to map broad spectral features in 3D, rather than the narrow emission lines typically targeted by LIM. This approach enables 3D intensity mapping with some of the brightest features in galaxies' infrared spectra: the polycyclic aromatic hydrocarbon (PAH) emission bands. We forecast the detectability of PAH signals using feature intensity mapping with the ongoing SPHEREx mission in the near-infrared and the proposed PRIMA mission in the far-infrared. We find that S/N of ≳ 10 per redshift bin (Δ z = 0.1 at z < 0.5 with SPHEREx; Δ z = 0.5 at 1 < z < 5 with PRIMA) can be achieved for multiple PAH features, suggesting a promising prospect for mapping the aggregate PAH emission at cosmological distances with upcoming datasets.
Relevant Publication:
-
Feature Intensity Mapping: Polycyclic Aromatic Hydrocarbon Emission from All Galaxies Across Cosmic Time
Y.-T. Cheng, B. S. Hensley, T. S.-Y. Lai, 2025, ApJ, 993, 30, ADS, [arXiv:2506.13863]
Extragalactic Background Light
The Extragalactic Background Light (EBL) is the cumulative emission from all sources outside our own Galaxy. In near-infrared (NIR) wavelengths, its contributions are thought to include light from detected and unresolved galaxies, the diffuse stellar halo around galaxies known as intra-halo light (IHL), and faint signals from the first stars and galaxies of the Epoch of Reionization (EoR), with more exotic sources like decaying axions also proposed. The EBL is measured using several methods, including integrating deep galaxy counts, direct photometry, and analyzing spatial fluctuations of the background, but a long-standing puzzle remains. Some direct measurements found excess signal compared to the light from known galaxy populations. This excess has been attributed to IHL or EoR component, but the true composition of the NIR EBL is not yet fully understood, due to the challenge of controlling foreground systematics such as the zodiacal light and the diffuse Galactic light when measuring the diffuse background.
EBL Tomography with SPHEREx
When probing the EBL with diffuse intensity maps, the spectral and redshift information of the EBL emitting sources is entangled and cannot be directly measured by absolute photometry or fluctuation measurements. Cross-correlating near-infrared maps with tracers of known redshift enables EBL redshift tomography, as EBL emission will only correlate with external tracers from the same redshift. In Cheng & Chang (2022), we forecast the sensitivity of probing the EBL spectral energy distribution as a function of redshift by cross-correlating SPHEREx with several current and future galaxy redshift surveys. We predict that the near-infrared EBL spectrum can be detected tomographically out to z ~ 6.
Relevant Publication:
-
Cosmic Near-Infrared Background Tomography with SPHEREx Using Galaxy Cross-Correlations
Y.-T. Cheng & T.-C. Chang, 2022, ApJ, 925, 136, ADS, [arXiv:2109.10914]
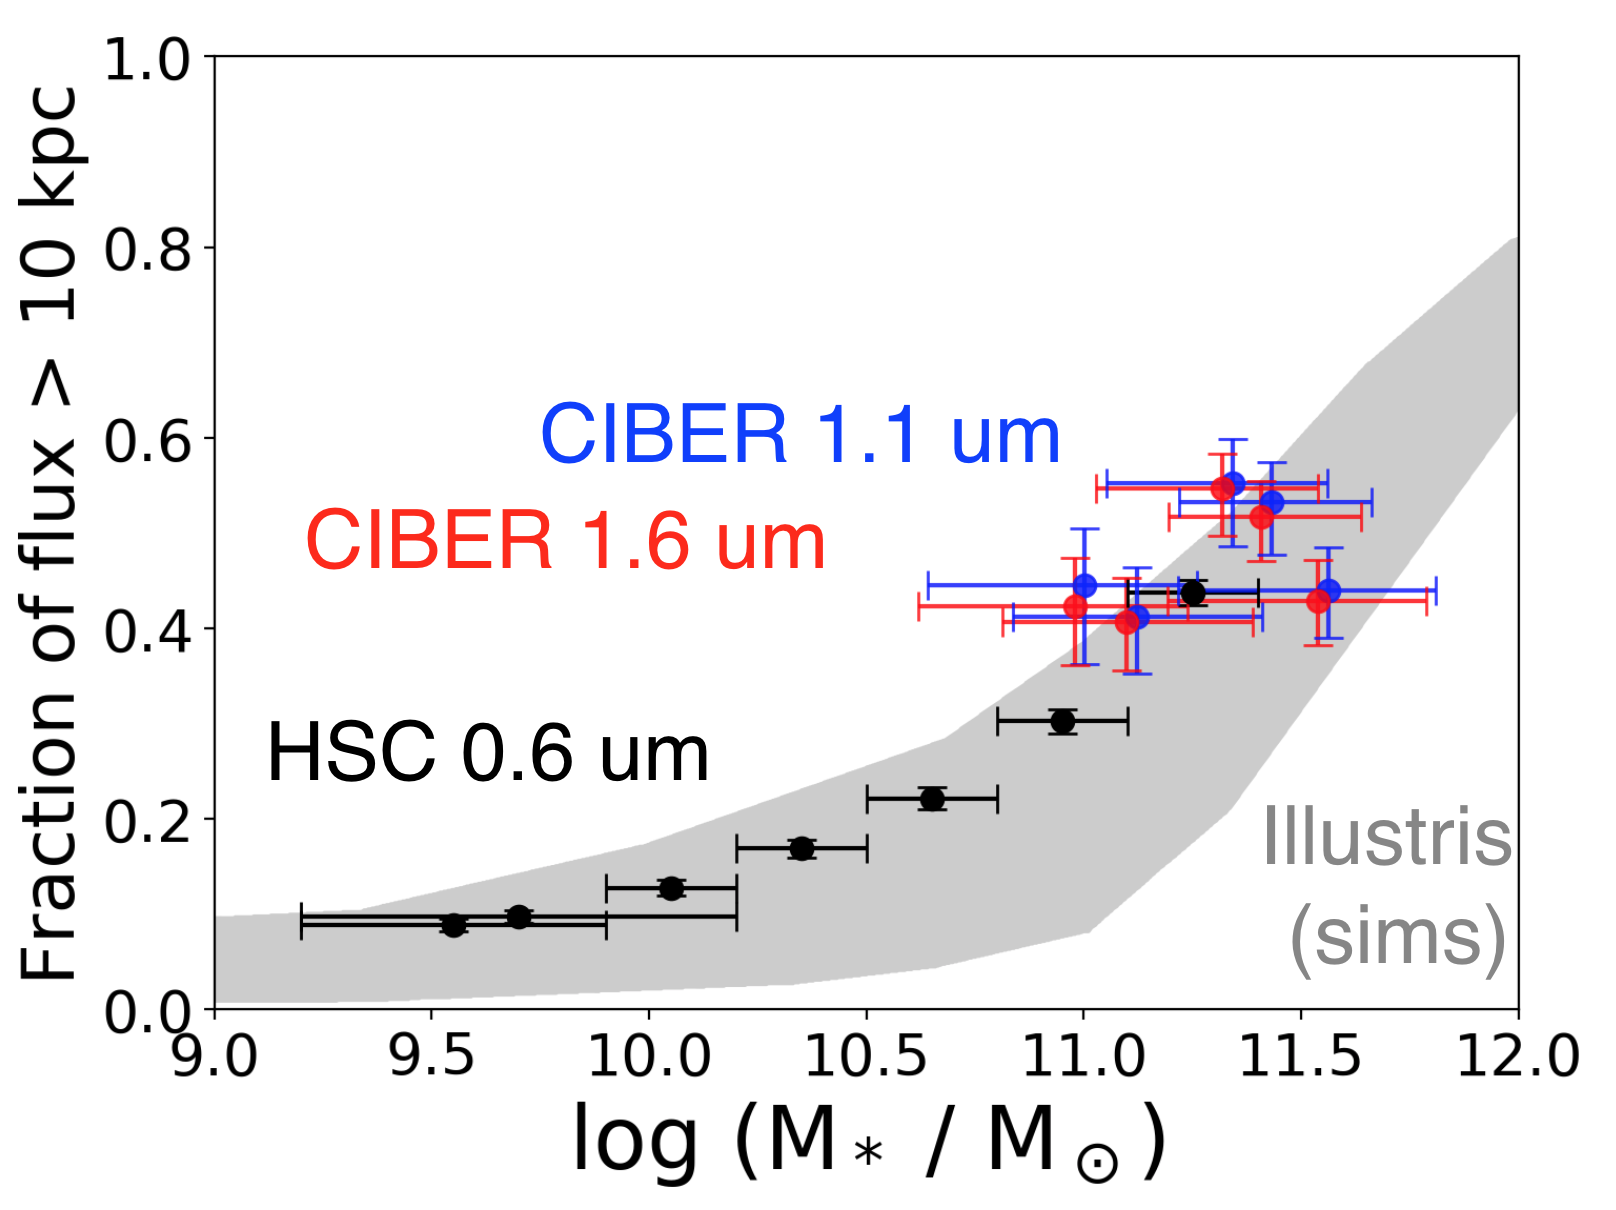
Intra-Halo Light in the Near-Infrared EBL
Analyses of EBL fluctuations indicate that the intra-halo light (IHL) is a significant contributor to the near-infrared background. The IHL originates from stars that have been tidally stripped from their parent galaxies and now reside within the surrounding dark matter halo, creating a faint, extended spatial distribution. In Cheng et al. (2021), we used a stacking analysis of CIBER imaging data to constrain the IHL around galaxies at redshifts of 0.2 < z < 0.5. In Cheng & Bock (2022), we used simulations to investigate how the EBL power spectrum depends on nonlinear clustering from satellite galaxies and on various IHL models.
Relevant Publication:
-
Near-infrared Extragalactic Background Light Fluctuations on Nonlinear Scales
Y.-T. Cheng & J. J. Bock, 2022, ApJ, 940, 115, ADS, [arXiv:2207.13712] -
Probing Intra-Halo Light with Galaxy Stacking in CIBER Images
Y.-T. Cheng et al. (CIBER Collaboration), 2021, ApJ, 919, 69, ADS, [arXiv:2103.03882]
Galactic Dust Modeling
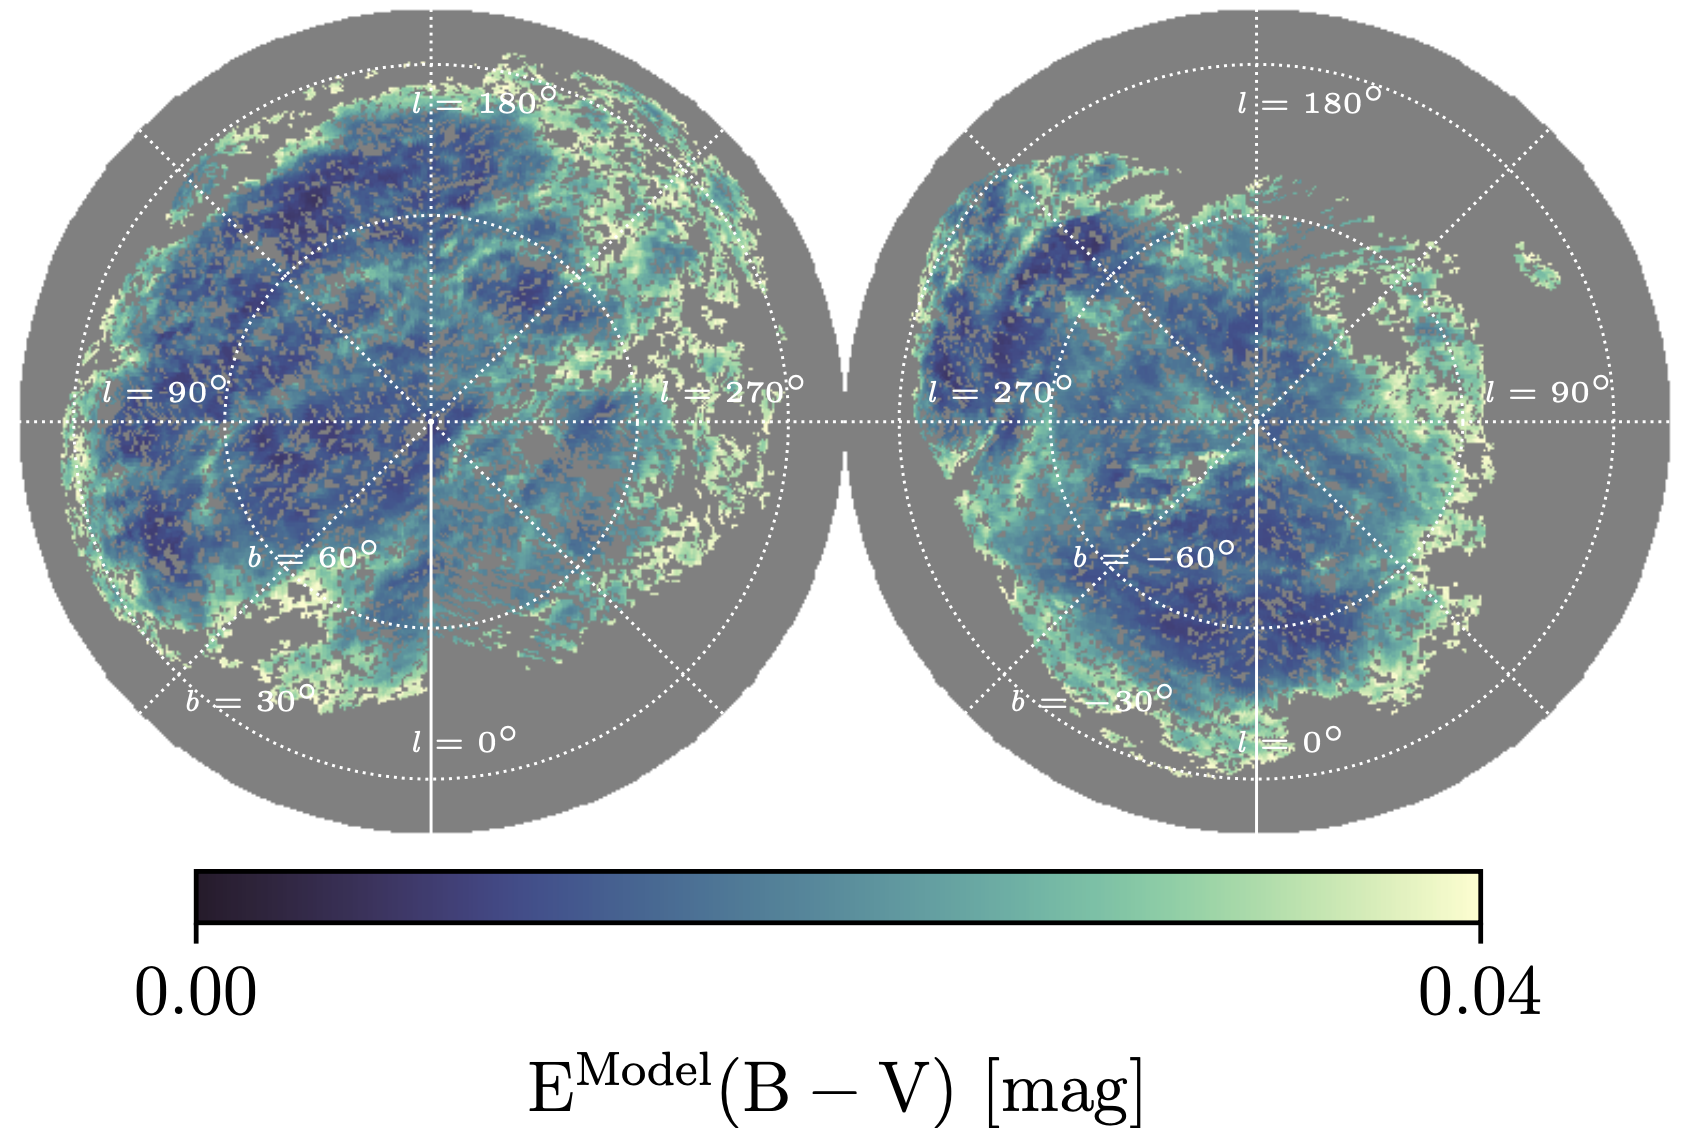
Galactic dust introduces color-dependent extinction to the light from extragalactic sources, a process that can significantly bias cosmological measurements if not accurately corrected. In the current era of precision cosmology, this correction is critical, as residual errors from dust models have become a dominant systematic uncertainty in large-scale structure surveys. This challenge will only intensify with the superior sensitivity of ongoing and upcoming missions like Euclid, Roman, Rubin, and SPHEREx. Current extinction maps are constructed using several methods, such as mapping far-infrared dust emission, measuring the reddening of background stars and galaxies, or using neutral hydrogen (HI) as a proxy for dust. However, each technique has its own shortcomings. Therefore, developing a more complete understanding of Galactic dust to build better extinction models is essential to unlock the full scientific potential of the next generation of cosmological surveys.
Galactic Dust Modeling with Multi-phase Tracers
In Cheng et al. (2025), we improve high-latitude HI-based dust templates by incorporating data from ionized and molecular gas phases. We make further improvements by employing a clustering analysis on the HI spectral data to identify discrete clouds with distinct dust properties. Our template has large-scale residuals at the level of < 20% when fitting to the dust emission from Planck. We quantify the contributions to these residuals from variations in the dust-to-gas ratio, dust temperature and opacity, and magnetic field orientation using ancillary datasets. Although residuals in a few particular regions can be attributed to these factors, no single explanation accounts for the majority. Joint analysis of multiple existing and upcoming datasets that trace Galactic gas and dust properties is needed to clarify the origins of the variation of gas and dust properties found here and to significantly improve gas-based extinction maps.
Relevant Publication:
-
Mapping Galactic Dust Emission and Extinction with HI, HII, and H2
Y.-T. Cheng, B. S. Hensley, T.-C. Chang, & O. Doré, 2025, ApJ, 985, 15, ADS, [arXiv:2411.12801]
Cosmic Dipole
The dipole in the cosmic microwave background (CMB) is understood to be a Doppler effect caused by our motion relative to the CMB's rest frame. A similar "kinematic dipole" is expected in observations of large-scale structure (LSS), and measuring it helps test the kinematic origin of the CMB dipole.
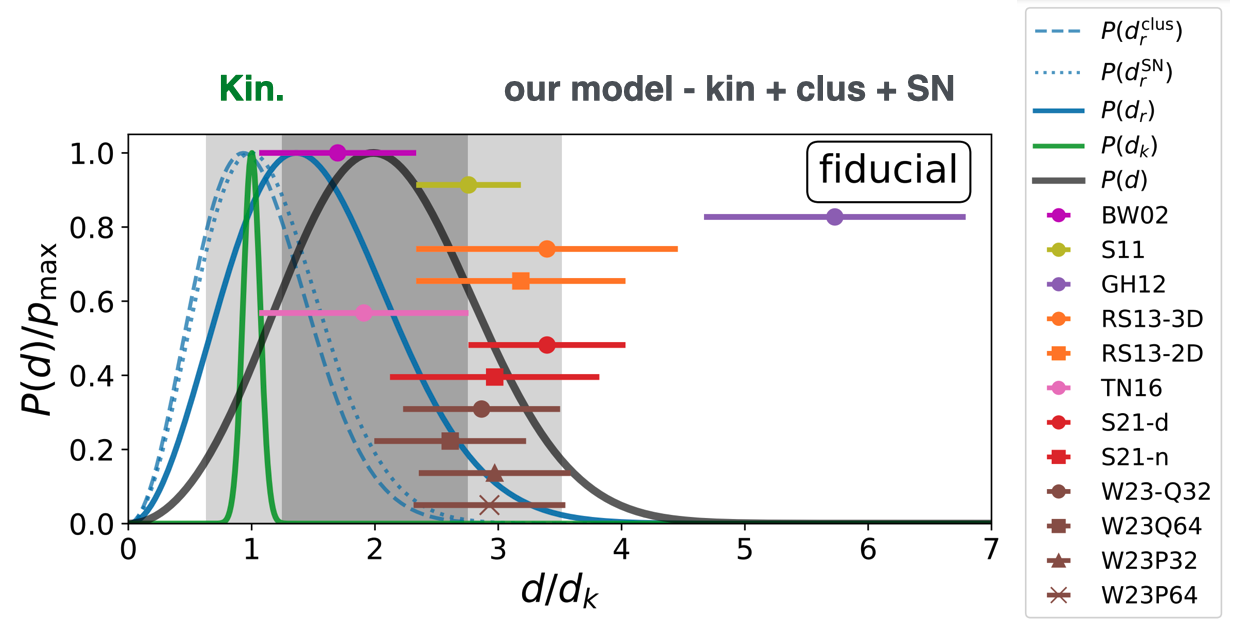
Is the Radio Source Dipole from NVSS Consistent with the CMB and ΛCDM?
Many previous measurements of the LSS dipole have suggested discrepancies with predictions from the CMB. In particular, several studies of the radio source dipole in the NVSS survey found an amplitude larger than expected, creating tension with the standard ΛCDM cosmological model. In Cheng et al. (2024), we reassess this tension by including a model for clustering and shot noise, effects ignored in some prior work, in our analysis of the NVSS dipole. Our results show the NVSS dipole is consistent with the CMB's kinematic origin within the ΛCDM model, highlighting the importance of accounting for these fluctuations when evaluating consistency.
Relevant Publication:
-
Is the Radio Source Dipole from NVSS Consistent with the CMB and ΛCDM?
Y.-T. Cheng, T.-C. Chang, & A. Lidz, 2024, ApJ, 965, 32, ADS, [arXiv:2309.02490]